
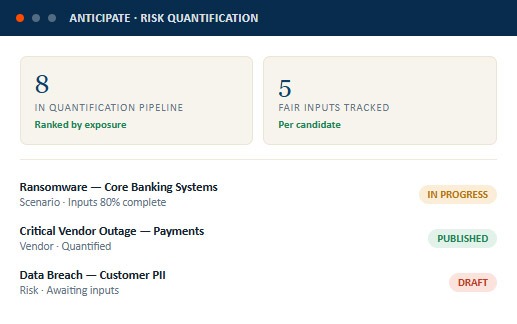
Threat actor, vector, vulnerability, frequency, loss
NCA, SAMA, ISO 27001, NIST CSF & more
ISO, NIST, SAMA, NCA, PDPL & more
Draft → in progress → in review → approved → published
Identity, Infra, Endpoint, Data, Cloud, Third-Party
Controls shared across 2+ frameworks
Risks, scenarios, assets, and vendors
CVSS · EPSS · KEV-aware prioritisation
Requirements mapped to a control
Simulation across every published model
Shared taxonomy, shared severity scale
Requirements without a control
Stop running FAIR analysis as a one-off workshop. Track the inputs, run the model, and roll every quantified candidate into one portfolio number.
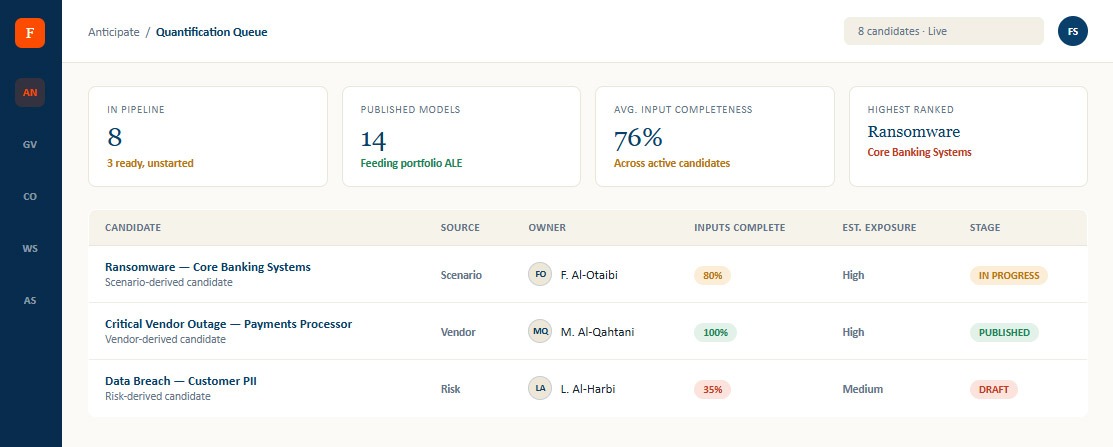
Not every risk needs a full FAIR model. Candidates surfaced from your risk, asset, scenario, and vendor registers, ranked by estimated exposure and quant readiness.
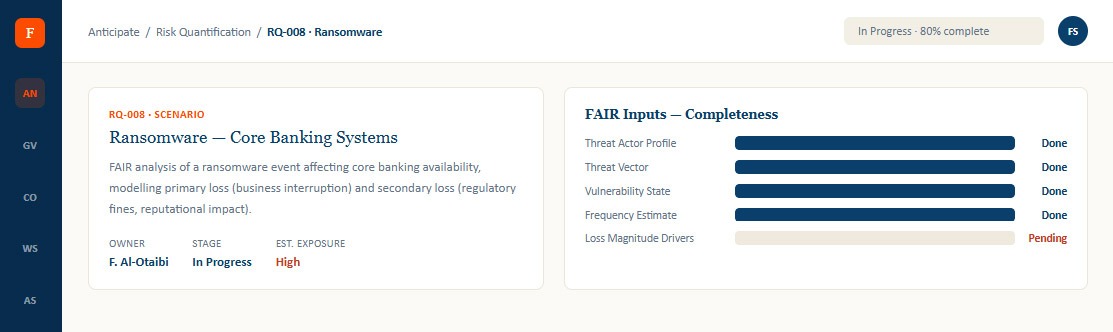
Threat actor, threat vector, vulnerability state, frequency, and loss drivers — tracked per candidate with visible completeness, so quantification never stalls.
Once quantified, a candidate's loss range is bucketed and ranked against every other candidate — so leadership reads a ranked list, not eight FAIR models.
Six connected capabilities that move FAIR analysis from a one-off consulting exercise to a repeatable, defensible programme.
Surfaced from your risk, asset, scenario, and vendor registers, ranked by estimated exposure and quant readiness — so analyst time goes where it matters first.
The five inputs every FAIR model needs — threat actor, vector, vulnerability state, frequency, loss drivers — tracked per candidate with visible completeness.
Every quantified candidate's loss range bucketed into an exposure band and ranked against the portfolio — leadership reads a ranked list, not eight models.
Each candidate moves through draft, in progress, in review, approved, published — with a queue showing exactly which ready candidates haven't been picked up.
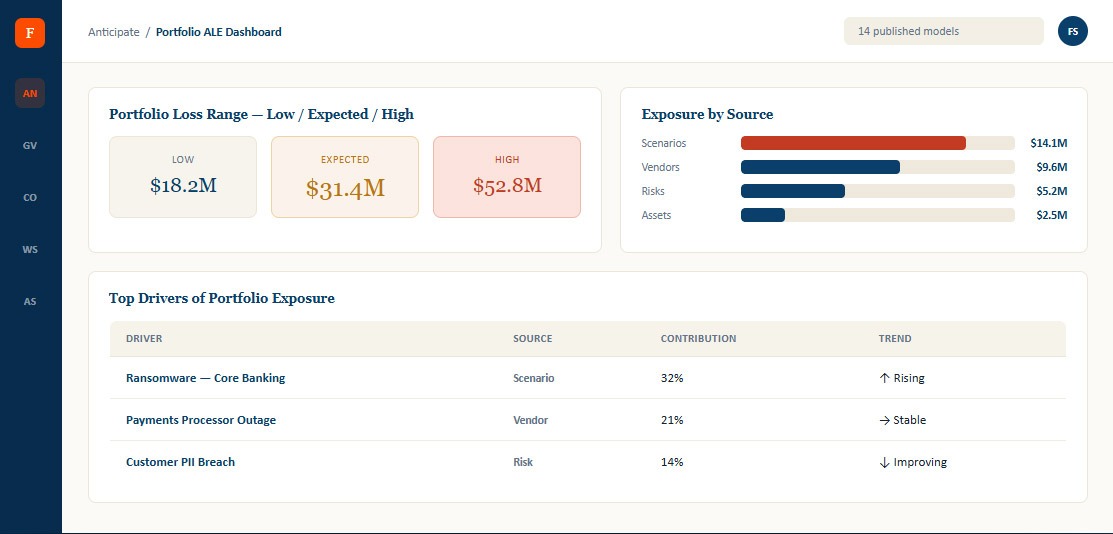
Every published candidate rolls up into one portfolio loss exposure range — low, expected, high — derived from Monte Carlo simulation.
The portfolio number means more when leadership sees the trend behind it and the factors amplifying it most — surfaced automatically, not built by hand.
Three screens
the ranked quantification queue, the FAIR model behind a single candidate, and the portfolio ALE dashboard the board reads from.
Risks, scenarios, assets, and vendors ranked by estimated exposure and quant readiness — so analyst time goes to what's worth quantifying first.
The five inputs every FAIR model needs, tracked with visible completeness — so quantification never stalls on "someone needs to fill this in."
Every published candidate rolled up into one portfolio loss exposure range — derived from Monte Carlo simulation, with the drivers behind it.
Surface quantification candidates from risk, asset, scenario, and vendor registers — ranked by exposure and readiness.
Threat actor, vector, vulnerability state, frequency, and loss drivers tracked per candidate with visible completeness.
Each candidate moves through draft, in progress, in review, approved, published — no quantification gets lost between steps.
Published candidates bucketed into exposure bands and ranked against the full portfolio — a list, not eight separate reports.
Every published model rolls into one portfolio ALE — low, expected, high — with the drivers explained automatically.
Quantification candidates ranked automatically — analyst time goes to what matters first
FAIR inputs tracked with visible completeness — quantification never stalls on a missing input
One portfolio ALE — low, expected, high — derived from Monte Carlo simulation, not a guess
Quantification runs as a workflow with a visible queue — nothing gets lost between stages
FalconryX infers missing FAIR inputs from data you've already captured, and runs the simulation
© 2026 Falconry360 . All rights reserved.